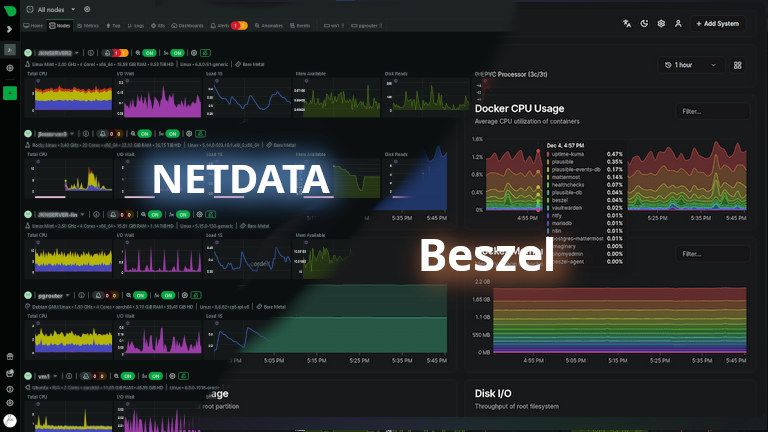
Switching from Netdata to Beszel

For years now, I've been using Netdata to monitor my servers, both local and remote nodes. It's a great system – easy to setup, well supported, and presents a great deal of data just by default, even before adding any of the many available plugins.
Not only does it make a nice dashboard for an overview of server statuses, but all that data lets you dive in to do some real troubleshooting without having to manually find and parse tons of logs.
But at the end of the day, Netdata is a commercial product for enterprise deployments. The free “community” account limits you to 5 nodes via their cloud aggregator; my “mini datacenter” and remote routers have passed that limit.
So began my search for a completely FOSS community project for server monitoring. Of course, there's the Grafana+Prometheus stack, but that's quite a bit of work and probably way too feature-rich for what I need.
Enter Beszel – a rather new and upcoming project that aims to offer a simple and lightweight monitoring system with a pretty GUI. Nice!
Setup
Beszel runs as a server + agents architecture. Both components can be installed via either Docker or a convenience bash script, each resulting in a container or systemd service accordingly. This worked great in most cases, except when it came to my “big boy” server running Enterprise Linux. Beszel doesn't come with a SELinux policy, and it only monitors either Docker or Podman hosts, but not both. A little tweaking was needed to setup the agent in Podman to disable container monitoring altogether. The agents installed just fine within Debian-based VMs, however. (Alpine is now supported too.)
Fair to say, Beszel isn't prioritizing the enterprise market, which is fine by me.
In use
Beszel does exactly what it says on the tin – simple, lightweight, and easy on the eyes. The homepage is a nice reactive dashboard with just simple linear bars for the most basic metrics of each node. Clicking into a node presents more metrics in pretty graphs. The CPU graph currently doesn't show app/cgroup breakdowns, but the Docker graph does show individual containers.
With Netdata, system load for agents was around 2-4% on 7th-gen Intel cores, with significant spikes when pulling the full data streams. Beszel OTOH runs really lean at less than 1%.
Alerts (email) are also really simple, with toggles for each of the basic metrics for each node.
Conclusion
Beszel is no enterprise monitoring system; and it doesn't pretend to be. Netdata and other solutions exist for that. Instead, it is a simple and useful dashboard for keeping an eye on your server fleet, with no commercial limitations. Perfect for the homelabber.